
TL;DR
Most MVPs cost between $15,000 and $80,000 and take 6 to 16 weeks. Roughly 43% of failed startups cite poor product-market fit, about 80% of software features are rarely or never used, and around half of all new US businesses are still trading after five years. The claim that 90% of startups fail has no verifiable primary source. And the evidence that AI makes engineers faster is far weaker than the marketing suggests: the one randomised trial run on real work in mature codebases found experienced developers were 19% slower with AI, while believing they had been 20% faster.
Every figure below names its source. Where we are giving our own practitioner estimate rather than published research, we label it as such rather than dressing it up as a survey.
Key Takeaways
- Most standard MVPs cost $15,000 to $80,000 and take 6 to 16 weeks. Tightly scoped single-flow builds land at the bottom of that range.
- 43% of failed startups cite poor product-market fit. Running out of cash is cited more often (70%) but is usually the symptom, not the disease.
- 80% of software features are rarely or never used, and just 12% of features drive 80% of daily usage (Pendo, 615 products).
- About half of new US businesses survive to year five, per BLS. That is a far cry from the "90% fail" figure repeated everywhere.
- The "90% of startups fail" statistic has no traceable primary source. It is only defensible for venture-backed companies over ten years under a strict definition of failure.
- AI's effect on developer speed is contested. A controlled task showed 55.8% faster; a trial on real work in mature repos showed 19% slower. Task type explains most of the gap.
- Only 31% of software projects are delivered successfully, with 50% challenged and 19% failed (Standish CHAOS).
- The standard product-market-fit benchmark is the Sean Ellis 40% test.
How to read these numbers
There are two kinds of figure on this page, and mixing them up is how bad statistics spread.
Third-party research. Everything on startup failure, feature usage, project outcomes, survival rates and AI productivity comes from named published studies, each linked. You can check every one.
Our own market estimate. The agency cost and timeline bands are ours. They reflect the quotes we see and compete against, and they are not drawn from a published survey. We label them that way because a number attributed to a vague "industry survey" you cannot look up is not evidence, and we would rather be honest about which is which than inflate our authority. Our own published prices are a third kind of figure: not an estimate at all, just what we charge.
How to cite these figures
If you are writing about MVPs and need one of these numbers, take the sentence and the source together. Every third-party figure here links to the study it came from; cite that study, and if this page saved you the search, a link back is appreciated but the study is the source. For our own figures, the attribution is "MVP Development, MVP & Startup Statistics 2026" with a link to this page. Two ready-made lines:
- "43% of failed startups cite poor product-market fit, according to CB Insights' analysis of 431 shut-down companies."
- "Agencies typically quote $15,000 to $80,000 for an MVP in 2026, while fixed-scope packages start at $350 for a working prototype (MVP Development)."
Quick reference: every figure on this page
| Metric | Figure | Source |
|---|---|---|
| Simple web MVP, typical agency quote | $15,000 to $40,000 | MVP Development market estimate |
| Standard SaaS MVP, typical agency quote | $30,000 to $80,000 | MVP Development market estimate |
| AI or regulated MVP, typical agency quote | $100,000 to $250,000+ | MVP Development market estimate |
| Simple MVP, typical agency timeline | 6 to 10 weeks | MVP Development market estimate |
| Standard SaaS MVP, typical agency timeline | 10 to 16 weeks | MVP Development market estimate |
| AI or regulated MVP, typical agency timeline | 16 to 24 weeks | MVP Development market estimate |
| Working prototype, fixed package | $350 in 7 days | MVP Development published price |
| Investor-ready MVP, fixed package | $1,450 in 21 days | MVP Development published price |
| AI feature premium | +15% to 30% | MVP Development estimate |
| Regulated industry premium | +20% to 40% | MVP Development estimate |
| High-growth startups failing through premature scaling | 74% | Startup Genome |
| Failed startups citing no cash | 70% | CB Insights |
| Failed startups citing poor PMF | 43% | CB Insights |
| Failed startups citing bad timing | 29% | CB Insights |
| Failed startups citing team problems | 23% | CB Insights |
| Failed startups outcompeted | 19% | CB Insights |
| Failed startups citing unit economics | 19% | CB Insights |
| Companies analysed by CB Insights | 431 | CB Insights |
| US businesses surviving year 1 | roughly 80% | BLS |
| US businesses surviving year 5 | roughly 50% | BLS |
| US businesses surviving year 10 | roughly one third | BLS |
| Features rarely or never used | 80% | Pendo (615 products) |
| Features driving 80% of usage | 12% | Pendo |
| Spent on unused cloud features | up to $29.5 billion | Pendo |
| Features never used | 45% | Standish Group |
| Features rarely used | 19% | Standish Group |
| Software projects succeeding | 31% | Standish CHAOS |
| Software projects challenged | 50% | Standish CHAOS |
| Software projects failing | 19% | Standish CHAOS |
| Agile project success rate | 42% | Standish CHAOS 2020 |
| Waterfall project success rate | 13% | Standish CHAOS 2020 |
| Agile outright failure rate | 11% | Standish CHAOS 2020 |
| Waterfall outright failure rate | 59% | Standish CHAOS 2020 |
| Speed-up on a controlled coding task | 55.8% faster | GitHub / Microsoft Research RCT |
| Effect on real tasks, mature repos | 19% slower | METR RCT (2025) |
| Developers' predicted speed-up | 24% faster | METR |
| Developers' perceived speed-up after | 20% faster | METR |
| Developers in the METR trial | 16, across 246 tasks | METR |
| Product-market fit benchmark | 40% "very disappointed" | Sean Ellis |
How much does an MVP cost in 2026?
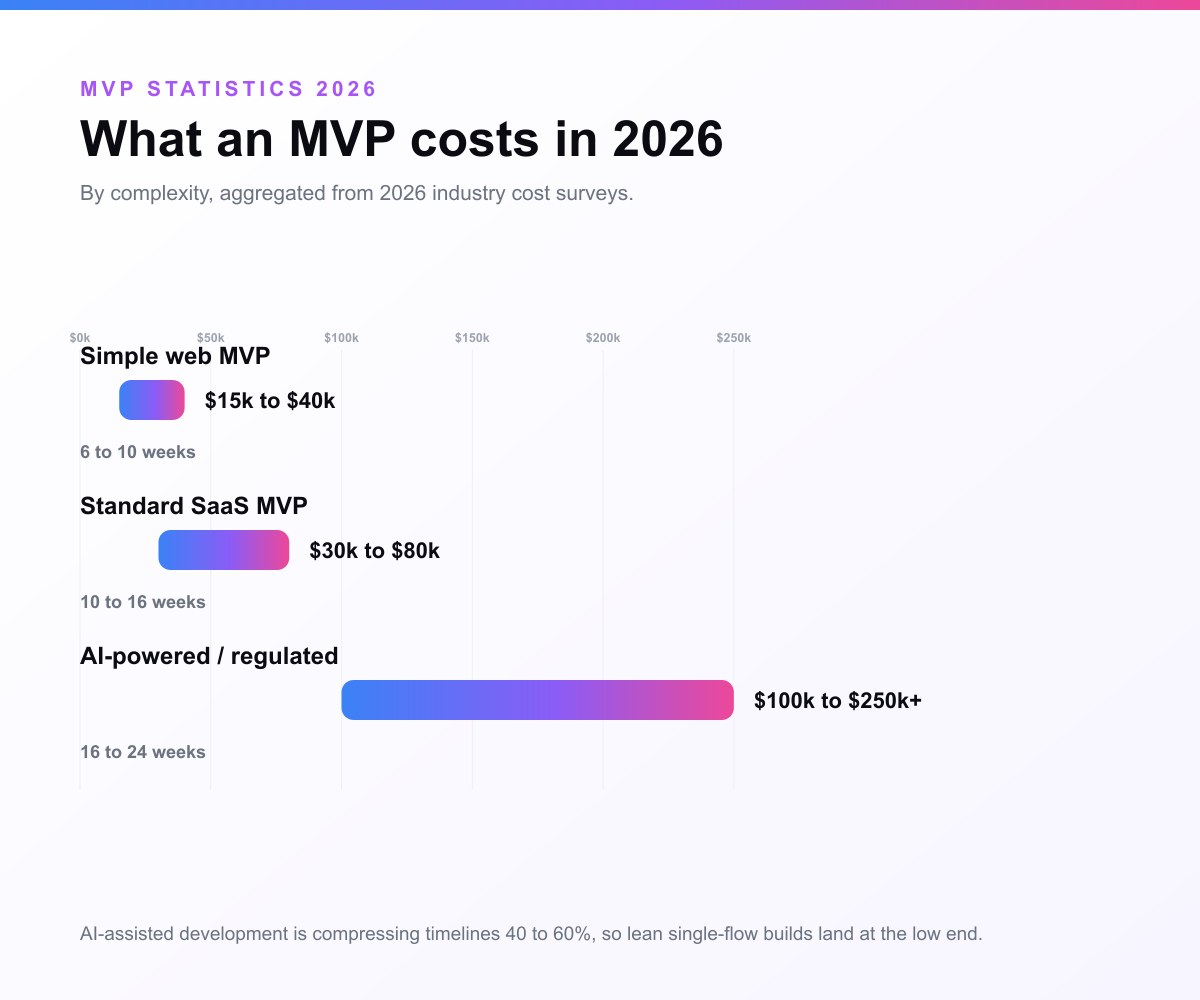
Agencies typically quote $15,000 to $80,000 for an MVP in 2026: $15,000 to $40,000 for a simple single-flow web MVP, $30,000 to $80,000 for a standard SaaS MVP with auth, payments and a dashboard, and $100,000 to $250,000 or more for an AI-powered or regulated build. The wide spread reflects how far the word "MVP" gets stretched. Our own published prices sit well under those bands, because the scope is fixed to one core flow: $350 for a working prototype in 7 days, $1,450 for an investor-ready MVP in 21 days. Both sets of numbers are below, labelled.
| MVP type | Typical agency quote, 2026 | Typical agency timeline |
|---|---|---|
| Simple web MVP (one core flow) | $15,000 to $40,000 | 6 to 10 weeks |
| Standard SaaS MVP (auth, payments, dashboard) | $30,000 to $80,000 | 10 to 16 weeks |
| AI-powered or regulated MVP (fintech, healthtech) | $100,000 to $250,000+ | 16 to 24 weeks |
Two patterns sit on top of those bands:
- AI features add roughly 15 to 30% to a budget, for data preparation, evaluation and guardrails.
- Regulated industries carry a 20 to 40% premium for compliance work such as HIPAA, SOC 2 or KYC.
The bands above are what agencies typically quote, based on the quotes we see and compete against. Treat them as a practitioner's market estimate, not as research. For the full breakdown see how much it costs to build an MVP and how long it takes.
Our own prices are not an estimate; they are published on the pricing page and fixed before work starts:
| Package | Published price | Delivery |
|---|---|---|
| Working AI Prototype (one core flow, live on a real URL) | $350 | 7 days |
| Lean AI MVP (investor-ready MVP) | $1,450 | 21 days |
| AI SaaS Build | $2,950 | 45 days |
The gap between the two tables is the point of a fixed-scope build: an agency quote prices an open-ended engagement, a package prices one defined outcome.
Why do startups fail?
Running out of cash is the most-cited reason at 70%, followed by poor product-market fit at 43% and bad timing at 29%. CB Insights analysed 431 VC-backed companies that shut down from 2023 onward. Most cite more than one cause, so the figures exceed 100%.
| Failure reason | % of failed startups citing it |
|---|---|
| Ran out of cash / could not raise | 70% |
| Poor product-market fit / no market need | 43% |
| Bad timing | 29% |
| Team problems (co-founder conflict, hiring) | 23% |
| Got outcompeted | 19% |
| Unsustainable unit economics | 19% |
One older figure keeps being cited alongside these, and it deserves its context: the Startup Genome project reported that 74% of high-growth internet startups failed through premature scaling, spending on growth before the product could carry it. It comes from a 2011 analysis of 3,200 companies, so treat it as a pattern, not a current rate; the pattern is the same one CB Insights finds in "no market need".
Source: CB Insights, "Why Startups Fail"; Startup Genome, Startup Genome Report Extra on Premature Scaling (2011).
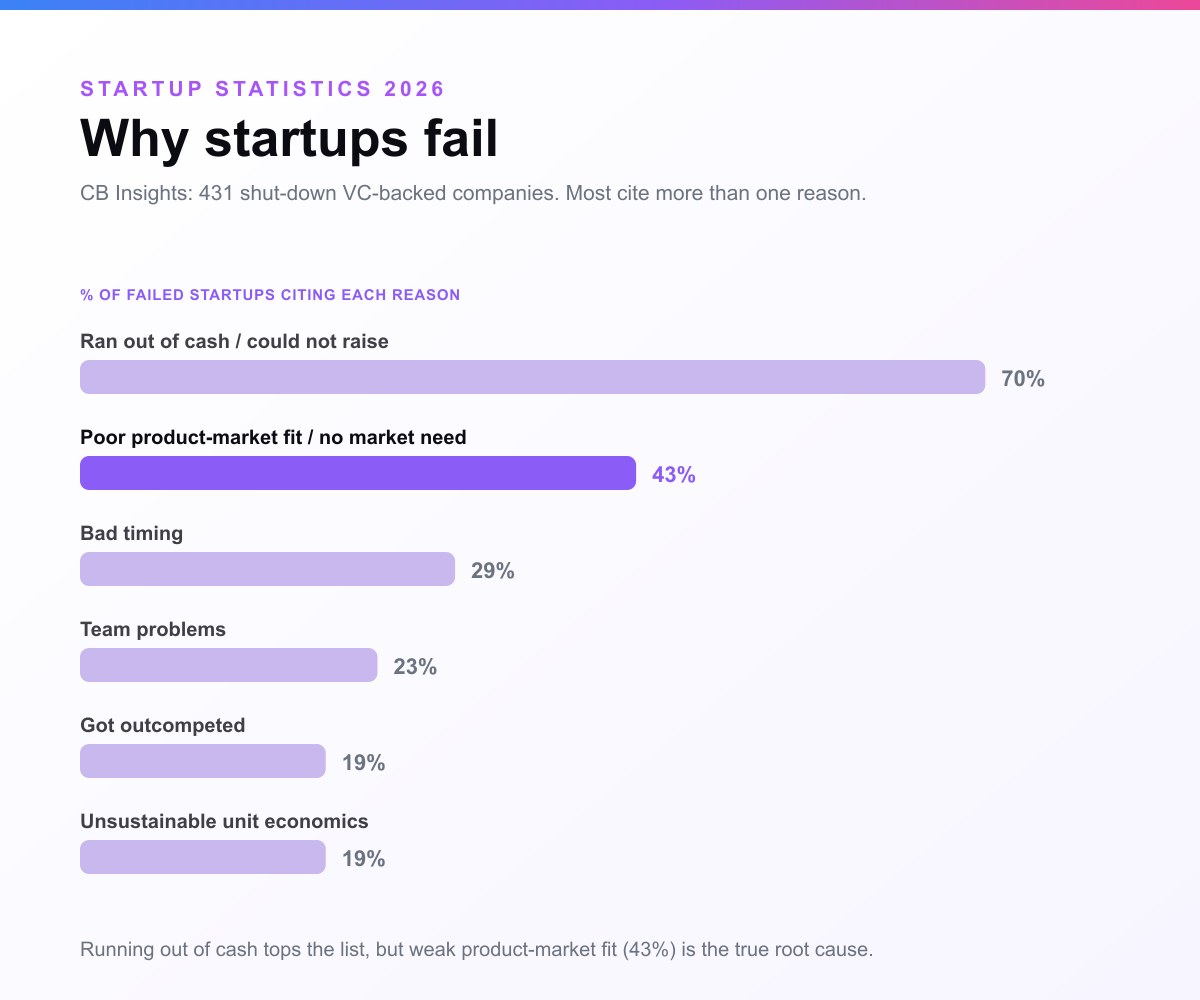
The nuance that matters: running out of cash tops the list, but it is almost always the symptom rather than the disease. Companies run out of money because they built something with weak product-market fit, timed it wrong, or out-scoped their runway. Poor product-market fit, at 43%, is the most common root cause, and it has sat near the top of this list for over a decade. See why MVPs fail for the failure modes specific to the build itself.
Do 90% of startups really fail?
No, and the figure has no traceable primary source. It is repeated constantly without attribution. The honest answer is that failure rate depends entirely on which companies you count and over what horizon, and the number changes enormously depending on both.
What the hard data actually says, from the US Bureau of Labor Statistics' Business Employment Dynamics programme, which tracks every private-sector establishment rather than a hand-picked sample:
- Roughly four in five new US establishments survive their first year.
- About half are still trading after five years.
- Roughly one third reach ten years.
Survival also varies sharply by sector. Health care and social assistance rank among the highest, while construction and food services rank among the lowest. Source: BLS, Establishment Age and Survival Data.
The "90%" figure is only defensible in one narrow framing: venture-backed startups, over ten years, where "failure" means any outcome short of a large investor return. That is a legitimate thing to measure, but it is not what most people think they are hearing, and it does not describe an ordinary software business.
Why this matters for your MVP: the base rate is not as apocalyptic as the folklore, but the reason companies do die is well documented and largely addressable. Building something nobody needs is the failure mode an MVP exists to catch.
How many software features actually get used?
About 80% of software features are rarely or never used, and just 12% of features drive 80% of daily usage. Pendo analysed usage across 615 software products from customers using its analytics for over a year, and estimated that public cloud-software companies collectively spent up to $29.5 billion building features that went unused.
The older Standish Group research reached the same conclusion from different data: 45% of features are never used and another 19% rarely used, 64% in total.
Both land on the same place: most of what gets built delivers close to zero value. For an MVP, where the point is to spend the least to learn the most, this is the whole game. See scoping an MVP and feature prioritization.
How often do software projects succeed?
Only about 31% of software projects are delivered successfully. Around 50% are challenged, meaning late, over budget or short on features, and 19% fail outright. Those are Standish Group CHAOS figures, drawn from a database of tens of thousands of projects.
The methodology split is stark:
| Approach | Successful | Failed outright |
|---|---|---|
| Agile | 42% | 11% |
| Waterfall | 13% | 59% |
Standish's 2020 CHAOS analysis covering 2013 to 2020 put agile projects at roughly three times the success rate of waterfall, and waterfall at substantially higher outright failure. The gap widens as projects get larger, which is itself an argument for keeping an MVP small.
Read alongside the feature-waste data, the message is consistent: scope size is the dominant risk factor in software delivery. Smaller projects succeed more often, and most of what you would add to make a project bigger will not be used anyway.
Does AI actually make building faster?
The evidence is genuinely mixed, and far weaker than most marketing implies. This is the number founders most often get wrong in 2026, so it is worth stating carefully.
The optimistic result. A controlled experiment run by GitHub with Microsoft Research found developers using Copilot completed a task 55.8% faster than a control group. The task was implementing an HTTP server in JavaScript from scratch.
The pessimistic result. METR ran a randomised controlled trial on real work: 16 experienced open-source developers, 246 tasks, in mature repositories where they averaged five years of prior experience. Developers allowed to use AI tools took 19% longer to complete tasks.
The most striking part of the METR result is the perception gap:
| Measurement | Figure |
|---|---|
| Speed-up developers predicted beforehand | 24% faster |
| Speed-up developers believed they got afterwards | 20% faster |
| Speed-up they actually got | 19% slower |
Sources: GitHub / Microsoft Research, METR, Measuring the Impact of Early-2025 AI (paper).
These two results are not actually contradictory, and the difference is the useful part. Greenfield code written from scratch, in isolation, with no existing context, is where AI helps most. Work inside a large, mature codebase you already know well is where it can cost more time than it saves, through review, correction and prompt overhead.
Two honest caveats. METR is one study with 16 developers, not settled consensus, and the tools have moved since the early-2025 window it covered. METR themselves revised their experiment design in February 2026. The GitHub result, meanwhile, is a single narrow greenfield task and should not be read as a general productivity multiplier.
What this means for an MVP specifically. An MVP is close to the best case for AI assistance: new code, small surface, few legacy constraints. So expect real gains. But two things do not change. AI has reduced the cost of building, not the cost of building the wrong thing. And a developer's sense of being faster is demonstrably unreliable, which is an argument for measuring shipped outcomes rather than trusting the feeling of velocity.
What does product-market fit actually look like?
The standard benchmark is the Sean Ellis 40% test: if 40% or more of your users would be "very disappointed" if they could no longer use your product, you have product-market fit. Below roughly 40%, you have a product people like but do not need.
It remains the most practical PMF measure available, it costs nothing but a survey, and it is the single clearest signal separating an MVP that worked from one that did not. See MVP validation and product-market fit.
What the data means if you are building in 2026
- Scope is the lever. With around 80% of features going unused, 43% of failures tied to product-market fit, and success rates falling as projects grow, the highest-leverage decision is not your stack or your budget. It is what you refuse to build.
- Validate before you build. Product-market fit is the top root cause of failure. Talking to real users is the cheapest insurance in startup work and it happens before you spend anything on engineering.
- Do not assume AI has solved delivery. The best available trial on real-world work found experienced developers slower, not faster, while feeling faster. Speed without scope discipline just reaches the wrong answer sooner.
- The base rate is survivable. Half of new businesses reach year five. The "90% fail" folklore is not supported by the data, but the documented causes of failure are real and mostly addressable.
- Cash buys time, scope buys survival. You cannot out-fundraise a product nobody needs.
If you want that discipline applied to your own idea, put your idea through the same numbers.
Frequently asked questions
How much does it cost to build an MVP in 2026?
Most MVPs cost between $15,000 and $80,000. A simple single-flow web MVP typically runs $15,000 to $40,000, a standard SaaS MVP with auth and payments $30,000 to $80,000, and an AI-powered or regulated MVP $100,000 to $250,000+. These are our own quoting ranges rather than published survey data. Tightly scoped builds land at the low end of each band.
How long does it take to build an MVP in 2026?
A simple MVP takes about 6 to 10 weeks, a standard SaaS MVP 10 to 16 weeks, and a complex AI-powered or compliance-heavy MVP 16 to 24 weeks. These are practitioner estimates. If you are quoted 4 to 6 months for a single-flow product, treat it as a signal that the scope is too large rather than that the timeline is normal.
What percentage of startups fail, and why?
Per CB Insights' analysis of 431 shut-down VC-backed companies, the most-cited reasons are running out of cash (70%), poor product-market fit (43%), bad timing (29%), team problems (23%) and being outcompeted (19%). Running out of cash is usually the symptom; weak product-market fit is the most common root cause.
Do 90% of startups fail?
No. The figure has no traceable primary source and is repeated without attribution. BLS data shows roughly 80% of new US businesses survive year one and about half reach year five. The 90% number is only defensible for venture-backed startups measured over ten years, where failure means any outcome short of a large investor return.
What percentage of startups survive five years?
About half, according to US Bureau of Labor Statistics Business Employment Dynamics data, which tracks all private-sector establishments rather than a selected sample. Roughly four in five survive the first year and about one third reach ten years. Survival varies significantly by industry.
How many software features actually get used?
Per Pendo's analysis of 615 products, about 80% of features are rarely or never used, and just 12% of features drive 80% of daily usage. The Standish Group found 64% of features are rarely or never used (45% never, 19% rarely). Both point to the same lesson: most built features deliver little value.
How much money is wasted building features nobody uses?
Pendo estimated public cloud-software companies collectively spent up to $29.5 billion building features that went rarely or never used, based on 615 software products. That is the direct cost of skipping validation, which is exactly the waste an MVP's scope discipline exists to prevent.
Does AI make software development faster?
It depends heavily on the task. A controlled GitHub experiment found developers 55.8% faster implementing an HTTP server from scratch. A METR randomised trial on real tasks in mature codebases found experienced developers 19% slower, despite believing they were 20% faster. Greenfield work benefits most; work in large familiar codebases benefits least, and may cost time.
Is building an MVP still worth it now that AI can write code?
Yes, arguably more than ever, because AI changed the cost of building, not the cost of building the wrong thing. With roughly 80% of features going unused and poor product-market fit still the leading root cause of failure, faster building without scope discipline just reaches the wrong answer sooner.
What percentage of software projects succeed?
Around 31% are delivered successfully, 50% are challenged and 19% fail outright, per Standish Group CHAOS data. Split by method, agile projects succeed roughly 42% of the time against 13% for waterfall, and fail outright 11% against 59%.
What is a good product-market fit benchmark for an MVP?
The Sean Ellis 40% test: if at least 40% of your users would be "very disappointed" without your product, you have product-market fit. Below that, you have something people like but do not yet need.
Sources and references
Third-party research, each figure linked:
- CB Insights, Why Startups Fail: analysis of 431 shut-down VC-backed companies, 2023 onward
- Startup Genome, Startup Genome Report Extra on Premature Scaling (2011): 3,200 high-growth internet startups; the 74% premature-scaling figure
- Pendo, 2019 Feature Adoption Report: feature usage across 615 software products
- US Bureau of Labor Statistics, Establishment Age and Survival Data: business survival rates from the Business Employment Dynamics programme
- METR, Measuring the Impact of Early-2025 AI on Experienced Open-Source Developer Productivity and the full paper: the 19% slowdown result
- The Impact of AI on Developer Productivity: Evidence from GitHub Copilot: the 55.8% controlled-task result
- GitHub and Accenture enterprise study: enterprise adoption figures
- Standish Group CHAOS research: project success rates and feature usage
- Sean Ellis, the 40% product-market-fit test: the standard PMF benchmark
- Eric Ries, The Lean Startup: the validated-learning framework behind the MVP
Method note. This page separates published third-party research from our own practitioner estimates, and labels which is which. MVP cost and timeline bands are MVP Development's market estimates from the quotes we see and compete against, not survey data; our own published prices are listed separately and are not estimates. Where public research reports ranges rather than single medians, we present the range. Last updated September 2026.